
The index's rise was driven by large-cap stocks, amid low overall market liquidity.
Lower interest rates have boosted sentiment, but liquidity remains low.
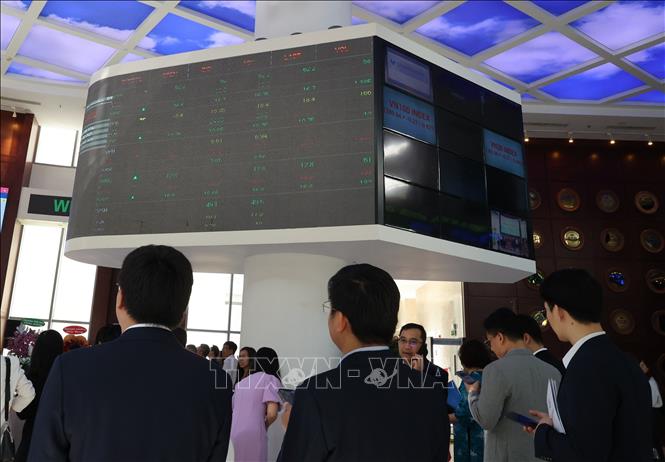
The Vietnamese stock market closed the trading week on a positive note, with the VN-Index rising 57.42 points to 1,704.31 points – placing it among the strongest-performing markets globally that week. The upward momentum started early in the week and was clearly reinforced in the final trading sessions.
The biggest contributor to the index's rise was the Vingroup group of stocks; in particular, Vinhomes (VHM) shares recorded a limit-up session, helping this group contribute an estimated 20 points to the VN-Index. The flow of money in the large-cap group showed a clearer selectivity, with the focus shifting from VIC to VHM.
In the same direction, the HNX-Index increased by 1.26% to 253.97 points, and the UPCoM-Index increased by 0.78% to 119.41 points.
A key supporting factor last week was the sharp cooling of interbank interest rates. As of December 18th, VND interbank interest rates had decreased by approximately 2.9 percentage points after a period of rapid increases; the State Bank of Vietnam conducted slight net withdrawals in the early sessions of the week. USD interbank interest rates also decreased across all maturities.
However, market liquidity has not improved proportionally with the upward trend. The total trading value across the market last week reached approximately VND 95,448 billion, a decrease of 14.65% compared to the previous week. On the HOSE, the average trading value remained below VND 20,000 billion per session, indicating that large capital flows are still observing from the sidelines. The 10.9% decrease in liquidity compared to the previous week and significantly lower than the 20-week average suggests that the upward trend has not yet been clearly confirmed.
The market experienced significant pressure from the chemical sector. Shares of Duc Giang Chemical Group JSC (DGC) fell by as much as 23.7% this week, reaching their lowest level in over two years, with a surge in trading volume. In the last two trading sessions alone, more than 37.7 million DGC shares changed hands, equivalent to approximately 10% of the company's charter capital.
This development prompted Techcombank Securities (TCBS) and MB Securities (MBS) to reduce the margin lending ratio for DGC shares, thus making the chemical sector the biggest loser of the week. In addition, VCK shares of VPS Securities Joint Stock Company – a newly listed company – also fell by more than 12% compared to the reference price, becoming one of the stocks with the most negative impact on the VN-Index.
Foreign investors returned to net buying of over 185 billion VND near the end of 2025, despite heavily selling off two large-cap stocks, VIC and DGC, with net selling reaching 2,370 billion VND.
On the HOSE exchange, foreign investors were net buyers for four sessions and net sellers for only one session on December 18th. In total, foreign investors were net buyers of over 46 million units, with a net buying value of 341.4 billion VND; while last week they were net sellers of 91.2 million units, with a total net selling value of approximately 5,803 billion VND. Despite this, cumulatively from the beginning of the year, foreign investors are still net sellers of over 138,000 billion VND.
Commenting on market trends, experts from Pinetree Securities Joint Stock Company believe that this recovery is showing better capital flow distribution compared to previous rallies, with the VN-Index receiving more even support from the banking, securities, and oil and gas sectors. However, most other sectors remain sideways, indicating that the market has not yet formed a medium-term bottom.
According to Vietnam Foreign Trade Commercial Bank Securities Company Limited (VCBS), the VN-Index surpassing the 1,700-point mark shows that the market's efforts are consolidating. Investors can continue to hold stocks that are on a stable upward trend, while selectively choosing stocks that successfully break through resistance or test support levels for short-term investment, prioritizing the banking, public investment, and securities sectors.
From a technical perspective, Asean Securities Joint Stock Company (AseanSC) stated that the VN-Index formed an Inside Bar candlestick pattern on the weekly chart, along with declining trading volume, reflecting the prevailing cautious sentiment. The nearest support zone for the index is around 1,660 - 1,670 points, while the nearest resistance is in the 1,740 - 1,750 point area.
Meanwhile, Vietnam Construction Securities Joint Stock Company (CSI) and BETA Securities Joint Stock Company both recommend that investors limit chasing rallies, prioritize a strategy of partial disbursement during corrections, and focus on stocks with strong fundamentals and that are attracting capital inflows.
After gaining nearly 60 points last week, the VN-Index is currently pausing around 1,700 points. The recovery momentum is being sustained by shifting demand across sectors, but lacks strong liquidity support.
Most securities firms agree that the appropriate trend in the current period is still recovery followed by accumulation, rather than a widespread, rapid increase. The preferred strategy is to maintain a reasonable portfolio allocation, observe the market's reaction around the 1,700-point mark, and only increase allocation when there is a clear upward movement supported by strong capital inflows.
While the Vietnamese stock market maintained a recovery and consolidation phase with cautious liquidity, developments on major global stock markets, especially Wall Street, also showed a tug-of-war situation as investor sentiment was intertwined between macroeconomic concerns and expectations of monetary policy.
US stocks are fluctuating between anxiety and hope.

The US stock market closed out a volatile trading week with a positive session on December 19th, as a rebound in technology stocks and a positive inflation report helped ease concerns about the health of the economy .
At the close of trading on December 19, the Dow Jones Industrial Average rose 183.04 points (0.4%) to 48,134.89 points. The S&P 500 advanced 59.74 points (0.9%) to 6,834.50 points, and the Nasdaq Composite technology index gained 301.26 points (1.3%) to 23,307.62 points.
Overall for the week, the market showed mixed results: while the S&P 500 and Nasdaq advanced 0.1% and 0.5% respectively, the Dow Jones index fell 0.7%.
The US stock market was divided into two halves last week, reflecting the conflict between economic data and persistent concerns about the valuation of technology stocks.
The trading week began with the December 15th session, when major indices all declined as investors awaited a series of key economic data releases that were delayed due to the US government shutdown.
On December 16th, selling pressure intensified after the jobs report revealed worrying signs. Although the number of jobs created in November was higher than expected, the economy lost 105,000 jobs in October, and the unemployment rate climbed to 4.6% – the highest level in four years.
Pessimism peaked on December 17th, when technology stocks led the market's sharp decline. Shares of Nvidia, a leader in artificial intelligence (AI) chips, fell as much as 3.8% that day. According to David Bahnsen, Chief Investment Officer at asset management firm Bahnsen Group, this development reflects the market's fatigue with isolated stories about AI infrastructure.
Over the last two trading sessions of the week, starting on December 18th, market sentiment reversed dramatically as inflation reports unexpectedly cooled. The Consumer Price Index (CPI) for November rose only 2.7% year-on-year, significantly lower than market forecasts. This data – along with booming earnings reports from chipmaker Micron Technology – rekindled hopes that the Federal Reserve would soon cut interest rates and indicated that demand for AI remains strong. Observers say these developments are a clear illustration of the complexity of the current US stock market.
Business activity data for December, compiled by S&P Global Market Intelligence, showed the lowest increase in six months, and business confidence also declined. According to Chris Williamson, chief economist at S&P Global, this development indicates that the recent momentum of U.S. economic growth is losing steam.
However, the fact that the November CPI rose less than expected compared to the same period last year is a game-changer. Bill Merz, head of capital markets research at US Bank's asset management firm, said the CPI report eased pressure on Fed policymakers. These figures give them more leeway to cut interest rates next year.
In addition, Micron's impressive earnings report helped boost sentiment for AI stocks. According to financial expert Patrick O'Hare of Briefing.com, the rise in major technology stocks helped stabilize a capital market that was showing signs of instability.
Regarding market sentiment, a notable warning signal has emerged. Bank of America reported that its "Bull & Bear" indicator has risen to 8.5 – a signal advising investors to sell based on historical data. Since 2002, after 16 occurrences of this signal, global stock markets have typically recorded negative results in the following three months.
Next week will be a shortened trading week due to the Christmas holiday and is expected to have low trading volume. The economic data release calendar does not have many notable events, except for reports on durable goods orders, third-quarter Gross Domestic Product (GDP), and new home sales.
Investors' attention will be focused on whether a "Santa Claus rally" will occur this year. This is a fairly reliable pattern in the history of the US stock market, typically happening during the last trading week of December and extending into the first week of January. However, over time, Santa's "gift" seems to have become less generous.
Over the past 100 years, December has been one of the best months of the year for the S&P 500, with an average increase of around 1.28%. However, in the last 25 years, the average increase for the index in December has fallen to just 0.5%. In fact, in the last five years, the index has recorded an average decrease of 0.2%, making December the second worst month of the year for the S&P 500, after September.
With the market having declined for the past two weeks and sentiment remaining fragile, traders continue to hope for a little "miracle" at the end of the year.
Source: https://baotintuc.vn/thi-truong-tien-te/vnindex-vuot-1700-diem-lan-thu-5-thi-truong-trong-nhip-tich-luy-20251221171131238.htm
![[Photo] Prime Minister Pham Minh Chinh presides over a meeting on private sector economic development.](/_next/image?url=https%3A%2F%2Fvphoto.vietnam.vn%2Fthumb%2F1200x675%2Fvietnam%2Fresource%2FIMAGE%2F2025%2F12%2F20%2F1766237501876_thiet-ke-chua-co-ten-40-png.webp&w=3840&q=75)

![[Photo] Prime Minister Pham Minh Chinh presides over the conference announcing the establishment of the International Finance Centre in Vietnam.](/_next/image?url=https%3A%2F%2Fvphoto.vietnam.vn%2Fthumb%2F1200x675%2Fvietnam%2Fresource%2FIMAGE%2F2025%2F12%2F21%2F1766309817714_ndo_br_dsc-3400-jpg.webp&w=3840&q=75)


Comment (0)