

Candidates taking the 2025 competency assessment exam of Hanoi National University of Education - Photo: NGUYEN BAO
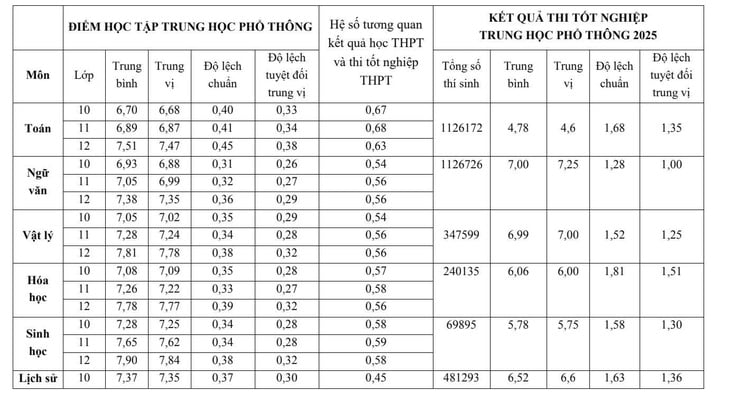
On the morning of July 22, the Ministry of Education and Training announced a comparison table of the correlation between the results of the 12-subject high school graduation exam and the academic records of students in 3 years of high school nationwide.
According to statistics, the average grade point average is 0.12 - 2.26 points higher than the high school graduation exam score.
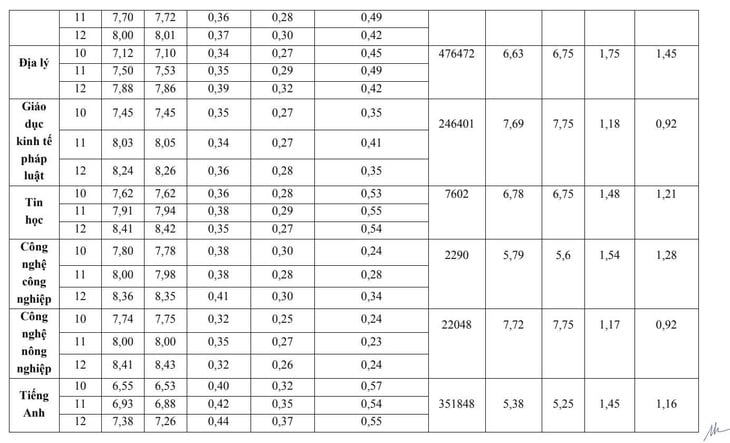
Industrial technology is the subject with the largest deviation in scores, with an average report card score of 8.05 compared to an average high school graduation exam score of 5.79, a deviation of 2.26 points.
Next is math with the average score of 3 years of high school transcript being 7.03, while the average score of the math graduation exam is 4.78 (2.25 points lower than the average score of the transcript).
If only considering the average math score of grade 12 of more than 1.1 million candidates taking the high school graduation exam, the score deviation is up to 2.73 points.
In English, the average score of the transcripts of more than 351,000 candidates taking the high school graduation exam was 6.95, while the average score of the high school graduation exam was 5.38, equivalent to a difference of 1.57 points.
Of the 12 graduation exam subjects, literature is the subject with the lowest deviation in scores. If the average score of the 3-year high school transcripts of more than 1.1 million candidates is 7.12 points, then the average graduation exam score is 7.0, corresponding to a deviation of 0.12 points.
The difference between the transcript score and the graduation exam score of 12 subjects is as follows:
| STT | High school graduation exam | Average grade point average of 3 school years | Average high school graduation exam score | Point deviation |
|---|---|---|---|---|
| 1 | Maths | 7.03 | 4.78 | 2.25 |
| 2 | Literature | 7.12 | 7.00 | 0.12 |
| 3 | Physics | 7.38 | 6.99 | 0.39 |
| 4 | Chemistry | 7.37 | 6.06 | 1.31 |
| 5 | Biology | 7.61 | 5.78 | 1.83 |
| 6 | History | 7.69 | 6.52 | 1.17 |
| 7 | Geography | 7.50 | 6.63 | 0.87 |
| 8 | Economic and legal education | 7.90 | 7.69 | 0.21 |
| 9 | Information technology | 7.98 | 6.78 | 1.2 |
| 10 | Industrial technology | 8.05 | 5.79 | 2.26 |
| 11 | Agricultural technology | 8.05 | 7.72 | 0.33 |
| 12 | English | 6.95 | 5.38 | 1.57 |
This year is the first year the Ministry of Education and Training has announced a comparison table of score distributions of some high school exam score combinations and academic records so that training institutions have a basis to determine the difference in scores between combinations, if any.
According to the 2025 admission regulations, universities using multiple admission methods/combinations for a major/training program will have to convert scores to a common scale and an equivalent standard score. The Ministry of Education and Training believes that this is to ensure fairness in admission.
Before the Ministry of Education and Training announced the correlation table between transcript scores and high school graduation exam scores, Hanoi University of Industry also announced the equivalent conversion table between transcript scores and high school graduation exam results.
According to the conversion table of Hanoi University of Industry, 8.0 converted transcript points are equivalent to 6.27 high school graduation exam points; 9.0 converted transcript points are equivalent to 7.23 high school graduation exam points; 9.20 converted transcript points are equivalent to 8.25 high school graduation exam points.
The correlation between the scores of high school graduation exams and the average scores of high school subjects (report cards) is calculated by the Ministry of Education and Training as follows:
Source: https://tuoitre.vn/diem-hoc-ba-lech-diem-thi-tot-nghiep-thpt-hon-2-diem-20250722123103183.htm


![[Photo] Closing of the 1st Congress of Party Delegates of Central Party Agencies](https://vphoto.vietnam.vn/thumb/1200x675/vietnam/resource/IMAGE/2025/9/24/b419f67738854f85bad6dbefa40f3040)


![[Photo] Editor-in-Chief of Nhan Dan Newspaper Le Quoc Minh received the working delegation of Pasaxon Newspaper](https://vphoto.vietnam.vn/thumb/1200x675/vietnam/resource/IMAGE/2025/9/23/da79369d8d2849318c3fe8e792f4ce16)


![[Photo] Solemn opening of the 1st Congress of Party Delegates of Central Party Agencies](https://vphoto.vietnam.vn/thumb/402x226/vietnam/resource/IMAGE/2025/9/24/82a89e250d4d43cbb6fcb312f21c5dd4)


Comment (0)