
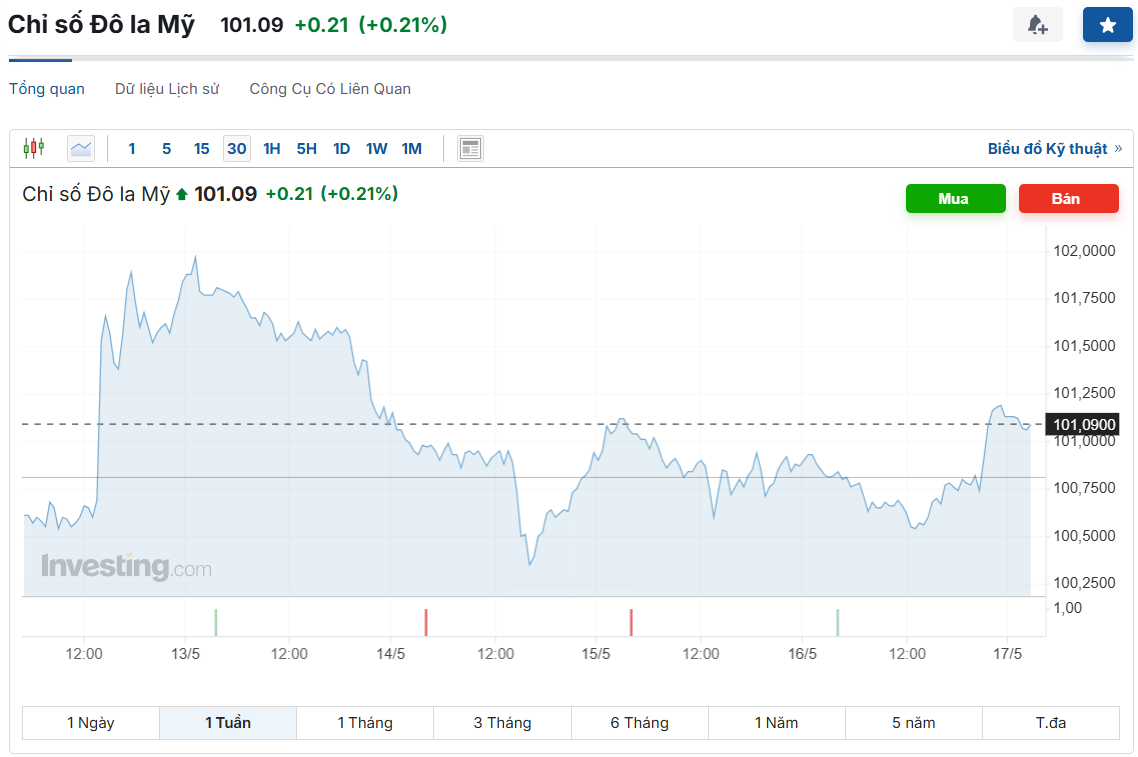
Dollar Index (DXY) last week
The US dollar (USD) continued to record its fourth consecutive weekly gain last week, marking a steady recovery after hitting multi-year lows in mid-April. The dollar index (DXY) fell to near 98.00 on April 21, but then surpassed the important 101 level earlier this week.
Positive signals from a series of recently reached trade agreements, especially between the US and China and the US and the UK. The US's 90-day suspension of heavy tariffs on Chinese goods, along with Beijing's soft response, have helped calm market sentiment.
Meanwhile, the trade deal with the UK, though still symbolic, has improved the US’s international trade position. At the same time, the sharp increase in US government bond yields across all maturities has also become an important support, reinforcing the attractiveness of the USD in a high-interest-rate environment.
However, the outlook for the USD exchange rate this week remains unclear as macroeconomic and policy factors continue to fluctuate.
Inflation in the US remained above the Fed’s 2% target in April, raising concerns that the Fed will keep interest rates high for longer than expected. Against this backdrop, investors have begun to push back expectations for a rate cut to the third quarter, with September considered the most likely date.
However, the market still needs to closely monitor new signals from the US Federal Reserve. This week, speeches by many Fed officials will become the focus, as investors expect more specific suggestions about the policy direction in the coming time.
In addition, preliminary data on US manufacturing and services activities will also help shape market expectations on the health of the economy and the performance of the USD.

Technical Forecast of USD Exchange Rate
Technically, the DXY is showing a cautious recovery but is still limited by key resistance levels. Despite breaking above 101, the index is still below its long-term moving averages such as the 200-day SMA (104.25) and 200-week SMA (102.79), indicating that long-term bearish pressure has not been completely eliminated.
If DXY clears 101.95, its recent peak in May, the index could continue to the 102.10 area (55-day SMA) and aim for a higher target at 104.25, its peak on March 26.
On the other hand, if the DXY weakens again, the 2025 support level at 97.92 (established on April 21) will be the nearest target. If the decline continues, the March 2022 low at 97.68 could become the next support zone.
Technical indicators are also not giving consistent signals at the moment. The RSI has crossed the neutral level of 52, signaling an uptrend is forming. Meanwhile, the ADX at 32 shows that the recovery momentum is increasing but still lacks clear certainty.
Source: https://baonghean.vn/du-bao-ty-gia-usd-tuan-nay-tiep-tuc-phuc-hoi-nhung-con-nhieu-thach-thuc-10297608.html


![[Photo] National Assembly Chairman Tran Thanh Man visits Vietnamese Heroic Mother Ta Thi Tran](https://vphoto.vietnam.vn/thumb/1200x675/vietnam/resource/IMAGE/2025/7/20/765c0bd057dd44ad83ab89fe0255b783)


Comment (0)