Is the bell-shaped spectrum good for general output assessment?
A lecturer at Ho Chi Minh City University of Education commented that the English score distribution in the 2025 high school graduation exam is really a beautiful chart if viewed from a technical perspective.
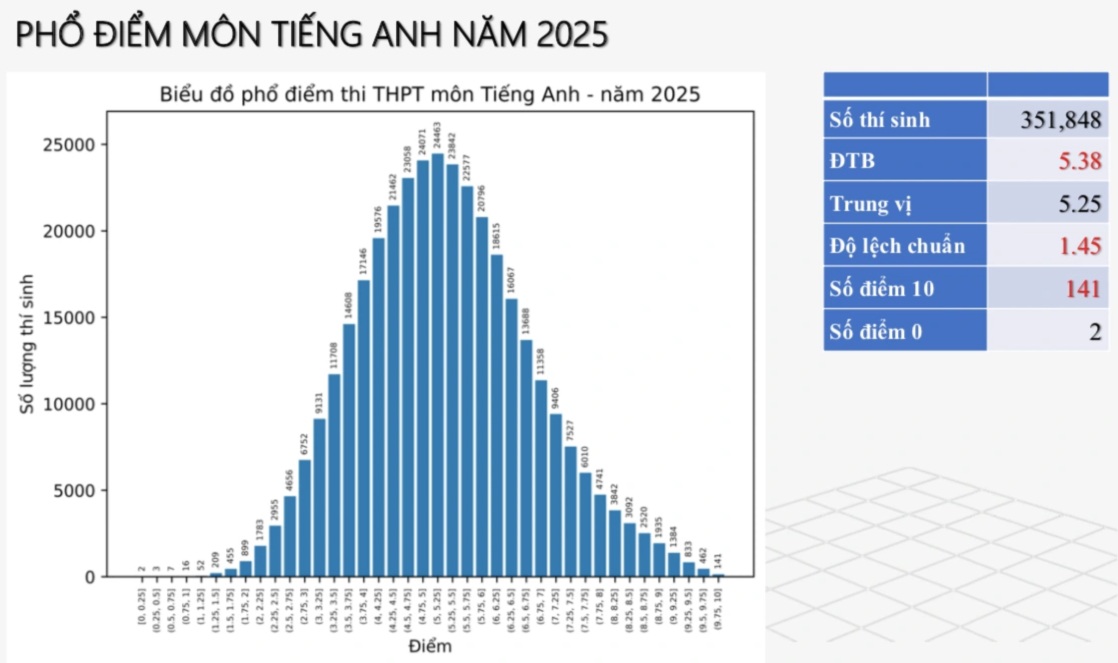
The distribution is approximately normal, with the peak concentrated in the range of 5.0–5.4, the standard deviation is 1.45, the mean score is 5.38 and the median is 5.25. The number of 10 points is very small, only 141 out of more than 350,000 candidates, showing that the exam is not easy to get a perfect score.


The English score distribution of the 2025 graduation exam is a very beautiful bell shape (Source: Ministry of Education and Training ).
At the same time, only 2 candidates received a score of 0, reflecting that the test was not too challenging or “trapped” for students. Such a score range is often assessed by measurement experts as having good differentiation, showing that the test was designed systematically and reasonably.
But she questioned whether an exam that produces such a wide range of scores can be considered good in all cases? Especially when this exam is also called “graduation”?
According to this lecturer, score spectrum analysis is not only a technical job but also reflects the educational philosophies behind it.
The score distribution tells us a lot about the difficulty of the test, the level of differentiation, the quality of teaching, and sometimes unusual signals.
A score distribution that closely approximates a normal distribution such as a bell curve is often considered ideal if the goal of the test is to classify students according to ability, for purposes such as admissions or class placement.
In the case of English this year, the score distribution shows that the test is not too easy, not too difficult, and can assess ability at many levels from weak to good.
But when we look back at the nature of the graduation exam, which is intended to test the minimum standard, that "beautiful" score range becomes controversial.
If we accept that the score distribution of an exam should follow a normal distribution, that is, that students' scores should fall into a symmetrical bell shape, then it is assumed that about half of the students will score below average.
The problem is, in a graduation exam to confirm that students have completed the general education program, is it reasonable that up to half of the students "fail" (if 5 is taken as the passing mark)?

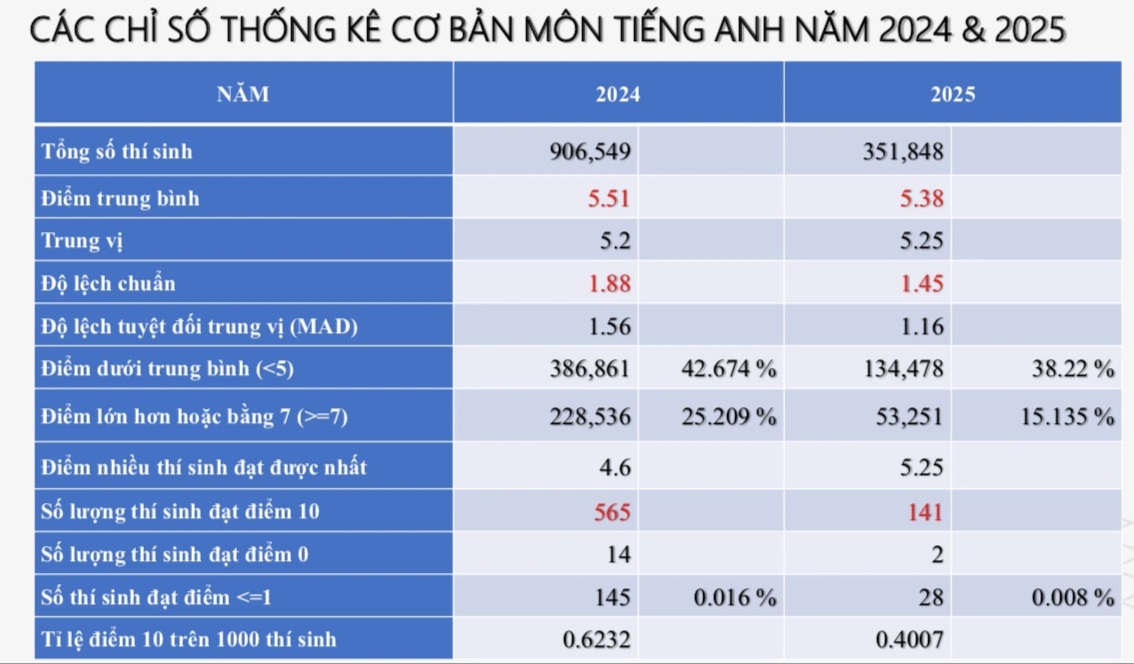
Basic statistical index of English test scores for high school graduation exams in 2024 and 2025 (Source: Ministry of Education and Training).
Is this a sign of poor student performance or a warning that the educational program has failed in its basic task of equipping learners with minimal competencies?
This person argues that the answer depends on how we understand and use the score distribution. If the goal of the exam is to classify students for admission, as in the university entrance exam, then a bell-shaped score distribution is desirable. The test must be differentiated enough to help universities select the right people.
But if the exam's main function is to assess general output standards, the ideal score distribution is not a beautiful bell shape, but a right-skewed score distribution, where the majority of students score average or above.
The average score becomes a mirror, not a place to "criticize" students.
The female lecturer said that general education is the foundation and graduating from high school must be something that the majority of students can do, if the education system is to be truly effective. A general education system cannot be satisfied if year after year, more than half of the students drop out before graduating.

Candidates in the 2025 high school graduation exam (Photo: Manh Quan).
From here, another question arises: If the test is really designed according to the required competency standards but the students' results are low, what does it mean? We cannot blame the test, because it does its job. We also cannot blame the students, because they do not study on their own in the program.
At that time, the cause may come from a series of problems such as the program being too heavy or far from reality, inappropriate teaching methods, dishonest assessment during the learning process or an unmotivating learning environment.
In this case, the score spectrum becomes a mirror not to "criticize" students, but for the entire education system to look at itself.
On the contrary, if the test is designed unreasonably, too easy or too difficult, not closely following the ability to be tested, then no matter how "beautiful" the score distribution is, it will not reflect the actual level of the students. In that case, the score distribution can be misleading, making teachers and students feel disoriented in adjusting their learning goals and methods.
Spectrum scores can tell a lot but what matters is how we understand them and how we use them.
If we know how to look at the score spectrum as a data source to analyze, adjust the test to suit the assessment goals, and to reorient the teaching and learning methods, it is a useful tool.

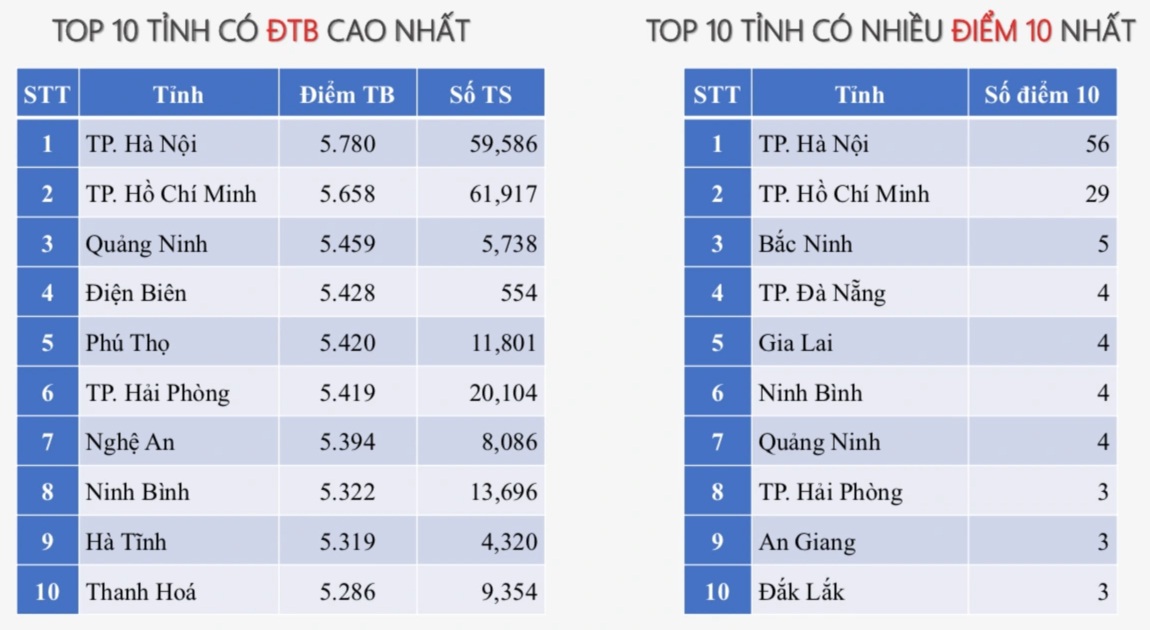
Top 10 cities with the highest average English scores and 10 provinces with the most 10s in English in the 2025 high school graduation exam (Source: Ministry of Education and Training).
If we only look at the score spectrum as a formal achievement or a result to report, its practical value will not be fully exploited.
The female lecturer emphasized that what is important is not whether the scores are "good" or "bad", but how each person participating in the educational process, from the learner, the teacher to the examiner, thinks and acts from those numbers.
Good score on paper
Dr. Nguyen Thanh Thuy, a professor of educational linguistics at Hanoi University, shared that the English score distribution of this year's high school graduation exam is good, but it is good in the sense of classifying candidates - meaning that this result is only suitable for university admission purposes, not for graduation exams.
This score range is only good on paper but not good in reality when students using this subject for university admission will have to compete with at least 4 groups such as the group applying for block A or C, the IELTS conversion group, the group using other foreign language test results (higher scores) and the group taking last year's English test.
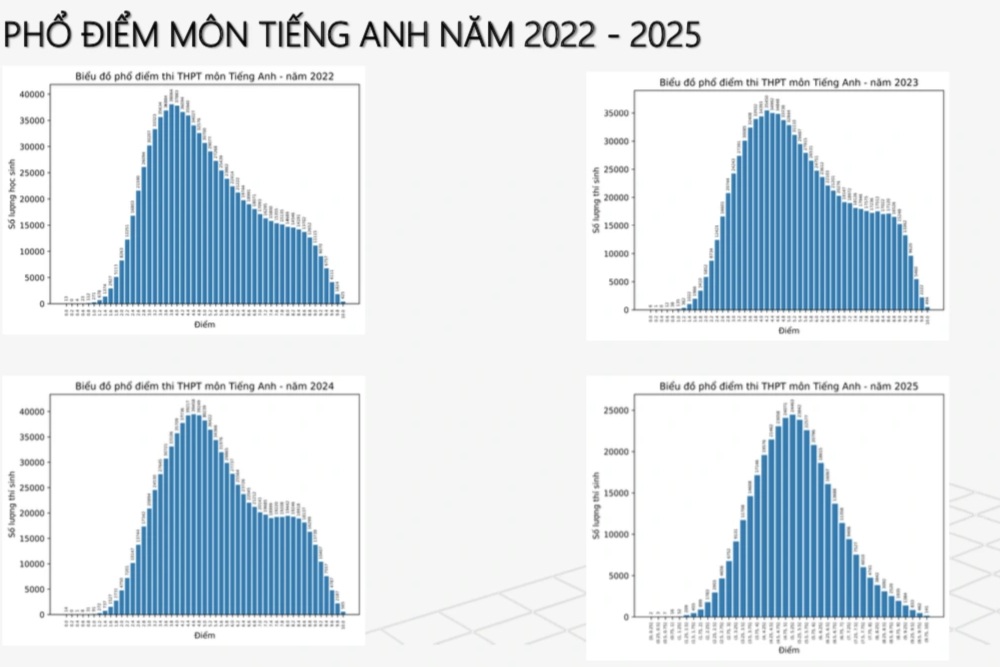
Dr. Nguyen Thanh Thuy analyzed that the total number of candidates taking the English exam in 2024 and earlier was nearly 3 times larger than this year - that is why the score distribution has 2 peaks. These 2 peaks mean that there exists a group whose English proficiency is higher than the general level of society, accounting for about 30%.

Many candidates may have difficulty using their English test scores in the high school graduation exam for university admission (Photo: Trinh Nguyen).
In 2025, English became an elective subject, the number decreased by about 1/3, it can be inferred that the top students are the ones who registered for English for the graduation exam.
Comparing the charts, it can be inferred that the second peak of the chart of the previous 3 consecutive years (around 8.5-9) is the average score of the top 30% group nationwide. This level is the level that needs to be compared with the average score of 2025, not the level around 5 points of the total of more than 900,000 candidates last year.
In other words, the average score of the good English group every year is 8.5-9 (high score inflation), but the average score of the good English group this year is more than 5 points. This average score shows that the exam was much more difficult than every year.
Dr. Thuy emphasized that this score range applies to the top English group nationwide and this score range shows that only a small number of students have reached C1-C2 level, the majority are still around B1-B2, meaning that the top of society is only at the same level as the Ministry's expectations.
Source: https://dantri.com.vn/giao-duc/pho-diem-tieng-anh-mot-bieu-do-rat-dep-nhung-chi-dep-tren-giay-20250718071002077.htm


![[Photo] 60th Anniversary of the Founding of the Vietnam Association of Photographic Artists](/_next/image?url=https%3A%2F%2Fvphoto.vietnam.vn%2Fthumb%2F1200x675%2Fvietnam%2Fresource%2FIMAGE%2F2025%2F12%2F05%2F1764935864512_a1-bnd-0841-9740-jpg.webp&w=3840&q=75)

![[Photo] National Assembly Chairman Tran Thanh Man attends the VinFuture 2025 Award Ceremony](/_next/image?url=https%3A%2F%2Fvphoto.vietnam.vn%2Fthumb%2F1200x675%2Fvietnam%2Fresource%2FIMAGE%2F2025%2F12%2F05%2F1764951162416_2628509768338816493-6995-jpg.webp&w=3840&q=75)


Comment (0)