
Provincial level has 2 indicators: Gross Regional Domestic Product (GRDP) per capita (GRDP/person) and Average Income per capita (TN/person) which can be said to be quite special. Because among hundreds of socio -economic indicators, these two indicators are not only calculated on average per capita but also compared with the general level of the region and the whole country. Moreover, there is often confusion between the 2 indicators, considering GRDP/person as TN/person, while the nature of these two indicators is different.
1. Identify indicators
Income in the most general sense is the amount of wealth in money that an individual, business or an economy, a locality or a country receives in a certain period of time, usually a year. Depending on the subject, income includes one or more of the following elements: (1) Salary, wages, (2) Production tax (minus the part of the state supporting production); (3) Depreciation, profit; (4) Mixed income (of agricultural and non- agricultural production households); (5) Other income (transfer of assets, profits, dividends, intellectual property rights, pensions, social benefits, gifts...).
Thus, from the income perspective, Son La province's GRDP is also income, but it is the income of the economy, generated within the province, regardless of ownership by people in the province or outside the province, or foreigners. Both GRDP and GRDP/person include 4 factors: (1) Salaries, wages, (2) Production tax, (3) Depreciation, profit, (4) Mixed income, but not including item (5) Other income. GRDP reflects the scale and potential of the province's economy and GRDP/person reflects the level of economic development. GRDP and GRDP/person are annual, calculated based on available statistical data.
Provincial income per capita is different, it is the income of the population, including 3 items: (1) Salary, wages, (4) Mixed income and (5) Other income, but not including item (2) Production tax and item (3) Depreciation, profit. Income per capita directly reflects the living standard of the people. It is surveyed periodically, calculated by month, from here it can be converted to year.
It is important to note that some important factors are and are not included in the GRDP or provincial income. In recent years, the central budget transferred to Son La is quite large (over 16 trillion VND, accounting for 75% of the province's budget revenue), but this source is not included in the province's GRDP, because GRDP is the total value of new products made in the area, not including the central government's transfer. Another factor is migrant workers. Son La province has more and more workers going to work in other provinces, currently there are tens of thousands of people. The results of their labor are included in the GRDP of the immigrant province, not in Son La. Only the income they send home is included in the province's population income.
Thus, GRDP/person and TN/person are somewhat similar in that they both include two factors: wages, salaries and mixed income. But the big difference is that GRDP/person includes factors such as taxes, depreciation, and profits, while TN/person does not. On the contrary, TN/person has other income factors that GRDP does not have.
GRDP and GRDP/person belong to the group of national account indicators. Meanwhile, TN/person belongs to the group of population living standards indicators. TN/person is usually significantly smaller, about 40% or more, than GRDP/person. The level of increase or decrease depends on each development stage of the country and each province. On the other hand, only TN/person is differentiated by subject groups (by urban, rural, by gender of household head, by economic region, by income source), with income inequality coefficients for the whole country and each locality.
2. Use indicators.
Although GRDP/capita and TN/capita have some similar elements, they are different in terms of group classification, nature, content, scale, and calculation method. Therefore, it is necessary to avoid overlapping and confusing the per capita between GRDP and TN. The most accurate way is to use the original phrase "GRDP per capita", or "per capita income according to GRDP". On the other hand, the indicator "per capita income" if called "per capita population income" is also clearer.
GRDP/capita is not only a statistical indicator, but also a basic indicator in the province's development planning to 2030 and vision to 2050, in the province's annual and 5-year socio-economic development plans and in resolutions of provincial Party Congresses. The traditional assessment method takes the implementation results with the set targets, from an internal perspective, sometimes increasing, but compared to the general level of the region and the whole country, it is regressing. Nowadays, every province has a tendency to compete for development, GRDP per capita is considered a basic indicator in the development ranking of the province in the region and the whole country. Therefore, to have more perspectives, the Government has decided (Decision 288/2022/QD-TTg on the framework for assessing provincial socio-economic conditions), from 2022, both the annual and 5-year GRDP and TN per capita indicators of the province will be compared with the whole country and the region. This is a new issue that needs to be updated and applied to the assessment of the socio-economic situation of the province.
GRDP/person is only calculated at the provincial level, while GDP/person is calculated at the district and commune levels. The district and commune levels do not calculate GRDP, so GDP/person is one of the basic indicators of socio-economic development and is a basic indicator to evaluate the level of new rural standards of communes. According to the Central Committee, the district level will be abolished in the future, and the commune level will be merged into a larger scale. The GDP/person indicator is becoming more important for the commune level. Previously, districts used the GDP/person indicator as one of the basic indicators to strive for development rankings in the province. Now the commune level uses this indicator not only to evaluate the level of new rural standards, but also to strive for development rankings in the province.
Reality also requires accuracy and reliability of calculated data. Before 2017, the provincial level calculated and published GRDP data. Due to many factors (methods, qualifications and achievement pressure), the accuracy of provincial GRDP is not really guaranteed (the total GRDP of the provinces is about 1.7 times higher than the national GDP). After 2017, provincial GRDP data has been appraised, adjusted and published by the General Statistics Office, so its reliability is higher. The data on income per capita, which is selected by local and commune statistics agencies in collaboration with households for survey and calculation (based on regulations and instructions of the General Statistics Office), also raises similar issues of concern regarding methods, qualifications and achievement pressure.
3. Son La province in the Northern midland and mountainous region and the whole country.
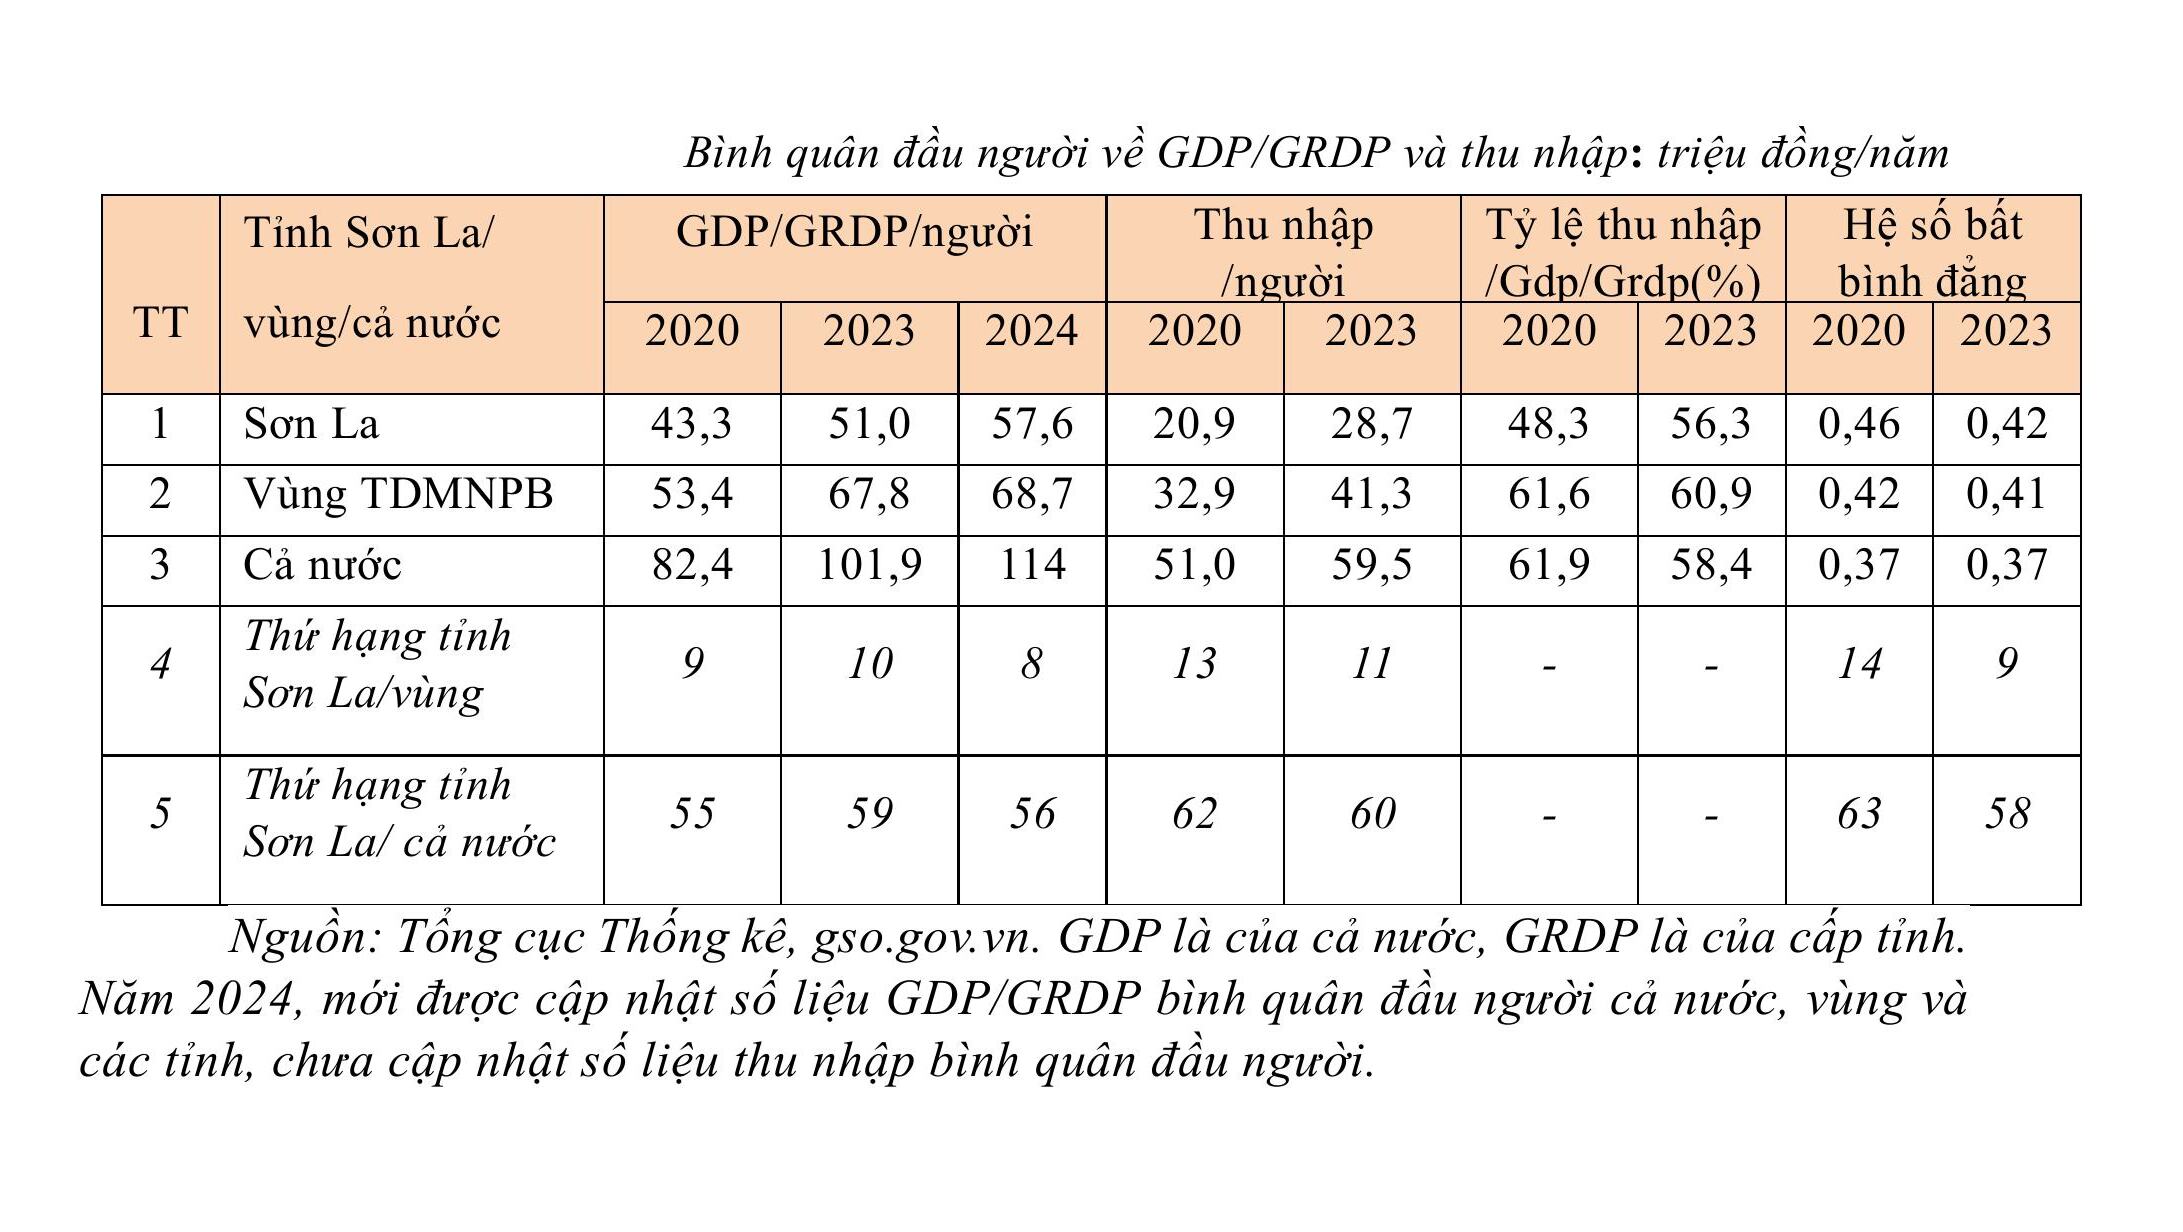
GRDP/person of Son La province tends to improve steadily, but the ranking improves more slowly, still standing at the bottom of the region and the country. That is because the GRDP growth of the province is lower and not as stable as the general level of the region and the country, while the natural population growth rate of the province is higher. TN/person and the ranking of the province also tend to improve, but the ranking is still at the bottom. The ranking of the province in TN/person is lower than the ranking of GRDP/person (3-4 levels). The average ratio of income per capita of the province compared to GRDP tends to improve, the difference has decreased sharply, but is still lower than the region and the country.
Among hundreds of socio-economic indicators, only the income inequality index (GINI) is understood as the income differentiation between groups from low to high. According to world standards, it has a value from 0 to 1, and is ranked in 3 categories: below 0.4 is low, from 0.4-0.5 is average, above 0.5 is high. Vietnam is currently below 0.4 in the low group, the Northern Midlands and Mountains region and Son La province are above 0.4, in the average group. Like the whole country and the region, the GINI of Son La province has a positive and decreasing trend, while the ranking also tends to improve, but is still at the bottom of the region and the whole country.
Phan Duc Ngu
Source: https://sonla.dcs.vn/tin-tuc-su-kien/noi-dung/hai-chi-tieu-dac-biet-5494.html


![[Photo] Discover the "wonder" under the sea of Gia Lai](https://vphoto.vietnam.vn/thumb/1200x675/vietnam/resource/IMAGE/2025/8/6/befd4a58bb1245419e86ebe353525f97)


![[Photo] Nghe An: Provincial Road 543D seriously eroded due to floods](https://vphoto.vietnam.vn/thumb/1200x675/vietnam/resource/IMAGE/2025/8/5/5759d3837c26428799f6d929fa274493)


Comment (0)