

Candidates taking the graduation exam in Ho Chi Minh City - Photo: NHU HUNG
However, praising a beautiful spectrum based solely on chart shape or intuitive feeling lacks scientific basis and can easily lead to misunderstanding.
A "beautiful" score spectrum is only valuable when it honestly reflects students' abilities according to output standards, ensures fairness between candidate groups and is built on the basis of objective, standardized multiple-choice test questions.
This year's math and English score distribution data are actually raising important warnings.
First, let's look at the specs. Maths had an average score of 4.78, with a median of 4.6 - nearly half of students scored below 5. Only 12% of candidates scored 7 or higher, while nearly 8% scored below 2.5.
The English subject has a mean score of 5.38 and a median of 5.25, but still has 38% below average. These figures cannot be called "beautiful" because they show a low average result and a skewed distribution - especially in math.
According to the assessment principle in multiple-choice testing, a score spectrum is only valid if it is accompanied by stable indicators of distribution, discrimination and reliability of the test.
The high school graduation exam is now a "two-in-one" exam - both for graduation and for university admission.
And to serve both the graduation and university admission goals, standard multiple choice tests are often designed with about 60-65% of questions at the recognition - comprehension level, the rest are at the application and high application level to classify candidates.
In test design, this is entirely possible if the question bank is standardized and the questions are pilot tested to determine difficulty and discrimination.
However, the reality shows that the current exam has not yet undergone a full standardization process. The transition to the 2018 general education program further exposed the confusion in exam design in math and English.
Due to the lack of standardization, the score distribution becomes unreliable. For math, this year's score distribution is slightly skewed to the right, with the peak falling around 4-4.5 points - meaning most candidates are concentrated at the low score level.
In a national exam, this means that many students do not meet the minimum requirements for general math proficiency.
Although the English subject has a more "balanced" score distribution, it actually reflects the results of a selected group of candidates - because this is an elective subject, only about 350,000 students took the exam, a sharp decrease compared to previous years. Nearly 40% still scored below average - a number that worries the public.
However, when the test is not standardized, this result mainly reflects the level of "test taking" but cannot confirm the level of "learning" or the actual quality of teaching. There needs to be more analysis by region, learning conditions and school context to have a valid conclusion.
Notably, while very few students score 9-10 in the graduation exam, many schools convert IELTS 6.5 into 9-10 English scores - creating a difference that can be unfair if not regulated transparently.
From the above data, the Ministry of Education and Training needs to fully implement the exam standardization process: build a question bank that closely follows output standards, test questions with representative samples, analyze difficulty - discrimination and test overall reliability.
The exam structure must be clearly designed and the matrix and objectives of each section must be transparently announced. This helps students to reduce the pressure of taking the graduation exam, while universities still have a basis for appropriate selection.
In addition, it is necessary to adjust the use of international certificates in admissions to avoid creating unfair advantages for a group of students.
Finally, score distribution evaluation should be based on statistical parameters - such as mean, median, standard deviation, score distribution, and test reliability - rather than just looking at graphs or experts' subjective opinions.
Source: https://tuoitre.vn/thi-tot-nghiep-thpt-2025-pho-diem-khong-the-dep-neu-thieu-chuan-hoa-20250719093601269.htm
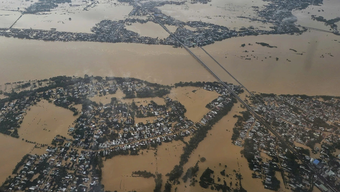
![[Photo] Da Nang: Water gradually recedes, local authorities take advantage of the cleanup](https://vphoto.vietnam.vn/thumb/1200x675/vietnam/resource/IMAGE/2025/10/31/1761897188943_ndo_tr_2-jpg.webp)


![[Photo] Prime Minister Pham Minh Chinh attends the 5th National Press Awards Ceremony on preventing and combating corruption, waste and negativity](https://vphoto.vietnam.vn/thumb/1200x675/vietnam/resource/IMAGE/2025/10/31/1761881588160_dsc-8359-jpg.webp)


Comment (0)