
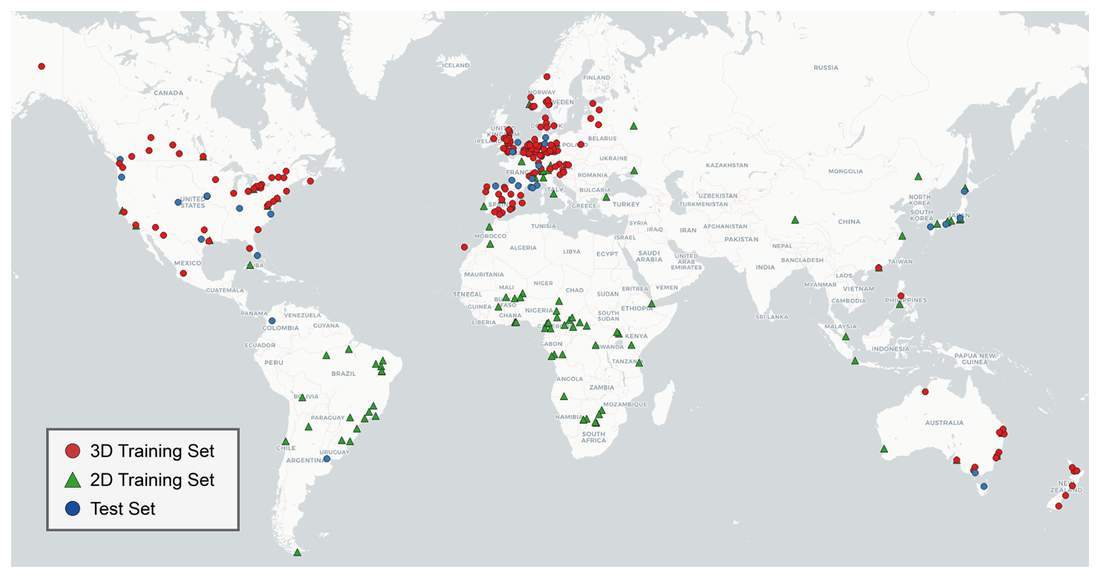
Distribution of city-scale areas of interest where training and testing data are collected - Source: Earth System Science Data/Article
This massive database promises to be a valuable resource for urban planning, climate change monitoring, and disaster risk assessment.
The project, called GlobalBuildingAtlas, combines satellite imagery and machine learning technology to create 3D models of virtually every building structure on the planet.
Published in the journal Earth System Science Data , this dataset contains information on 2.75 billion buildings. Each building is mapped in detail with floor area and height, achieving a spatial resolution of 3 x 3m.
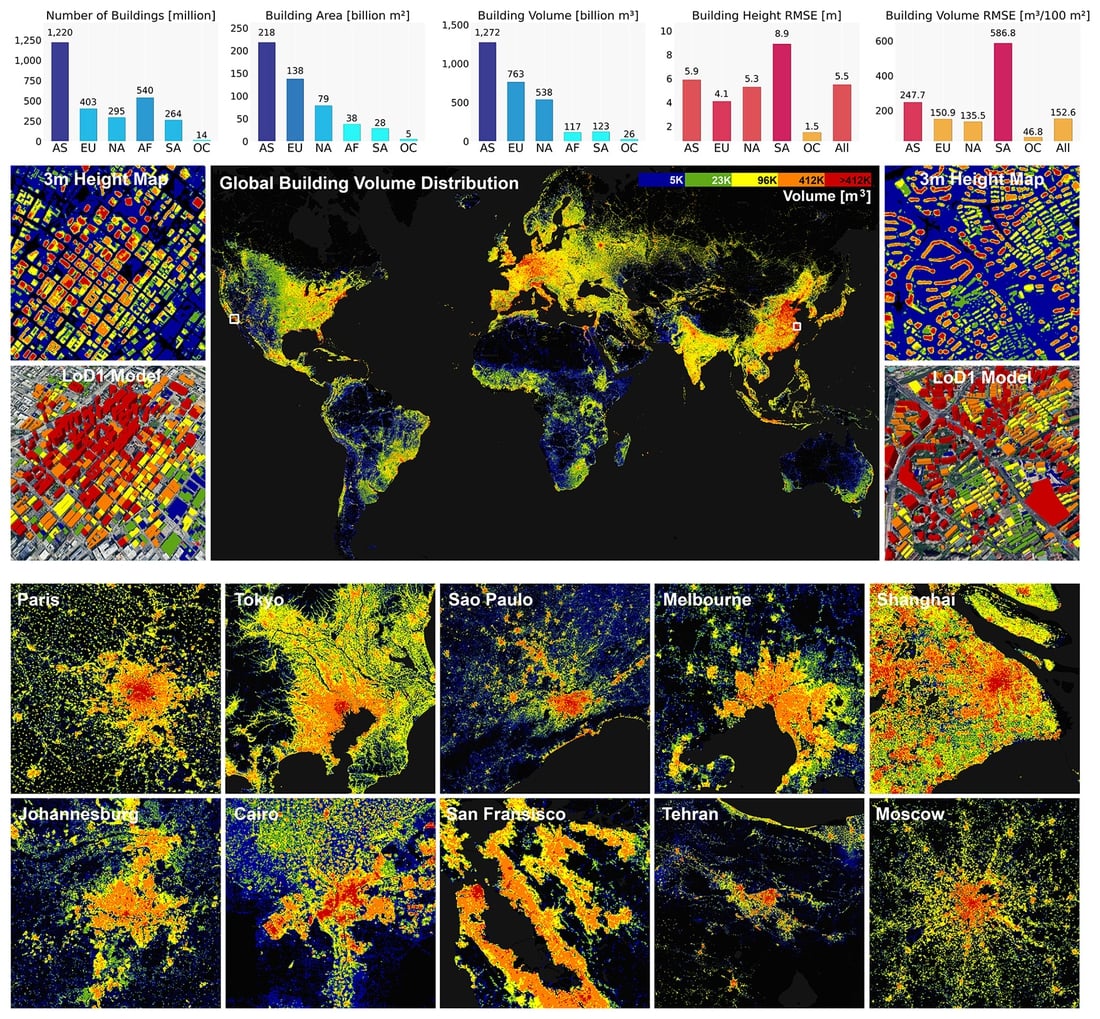
Overview of the GlobalBuildingAtlas dataset obtained, including global building polygons, building height maps, and models - Source: Earth System Science Data/Article
To complete the project, the research team processed approximately 800,000 satellite images taken in 2019. They used deep learning tools to predict the height, volume, and area of the building.
The tool was previously trained using reference data from laser scanning technology (LiDAR) of 168 cities, primarily in Europe, North America, and Oceania.
Data from the map shows that Asia accounts for nearly half of the world's buildings, with approximately 1.22 billion structures. The region also leads in total built volume (1.27 trillion m³ ), reflecting the rapid urbanization and high population density in China, India, and Southeast Asia.
Africa ranks second in terms of number with 540 million buildings, but the total volume is only 117 billion cubic meters, indicating the prevalence of small and low-rise structures.
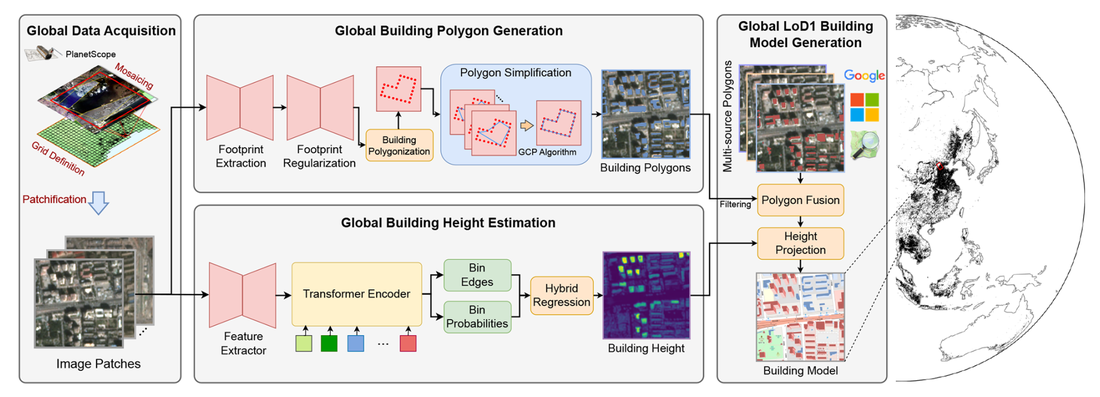
The workflow of a specific proposed building structure - Source: Earth System Science Data/Article
The study also highlighted significant disparities in living conditions and infrastructure.
For example, Finland has six times the amount of built-up area per capita compared to Greece. Meanwhile, Niger's figure is 27 times lower than the world average.
These 3D models offer a deeper insight than traditional 2D maps, which only measure surface area.
According to co-author Xiaoxiang Zhu from the Technical University of Munich (Germany), this map opens up new possibilities in assessing natural disaster risks, modeling climate, and helping to monitor the United Nations Sustainable Development Goals.
Dorina Pojani, an urban planning researcher at the University of Queensland (Australia), believes this dataset is extremely valuable because it allows for real-time monitoring of urban development, rather than relying on static data.
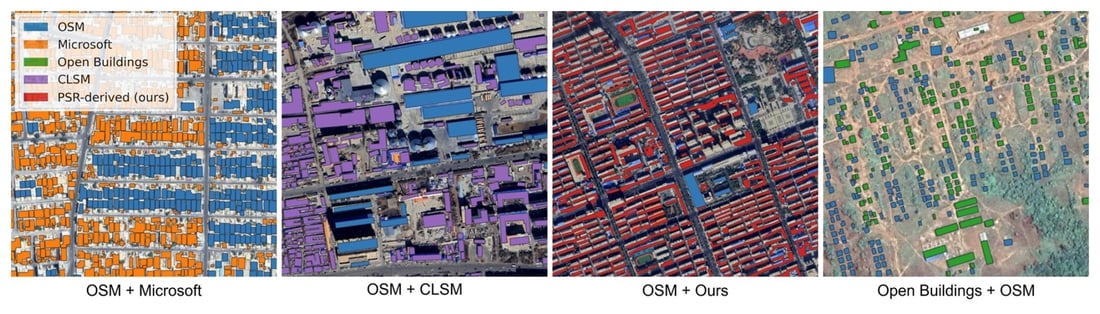
Examples of building polygons combined from multiple different floor plan data sources - Source: Earth System Science Data/Article
Notably, Ms. Pojani noted that this data also offers new opportunities to study corruption in the construction industry.
It allows researchers to "link buildings or projects to specific developers, companies, or political actors and question whether certain networks of people constitute a disproportionate proportion in high-value or strategically located projects."
Liton Kamruzzaman, a planning expert at Monash University (Australia), also praised the project's potential, particularly for areas around the world that currently lack planning information, helping to monitor urbanization more transparently.
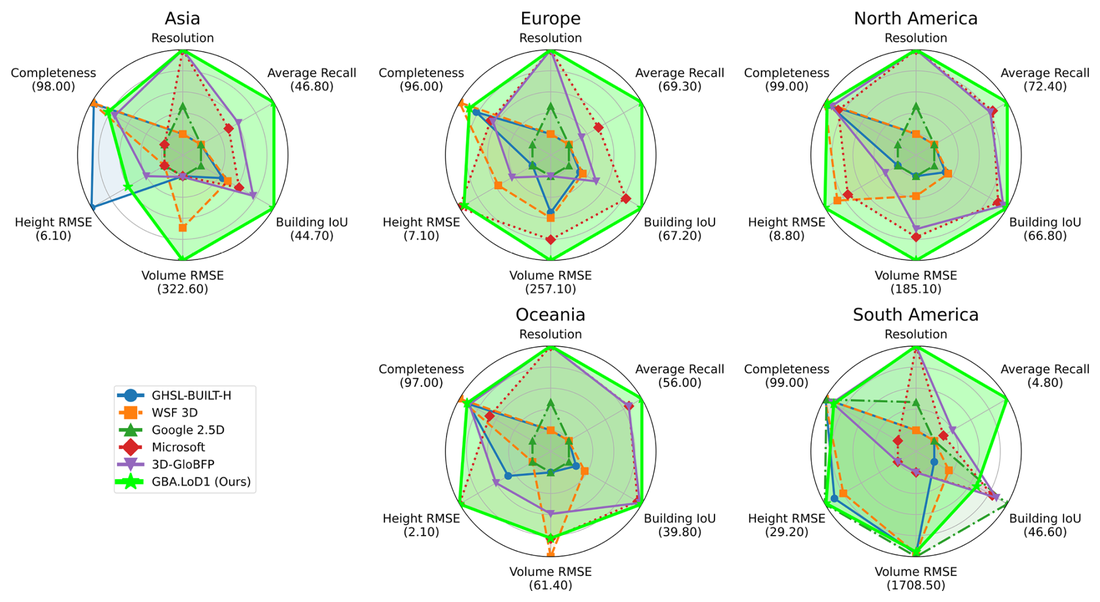
Overview of continental comparison results on large-scale building height products - Source: Earth System Science Data/Article
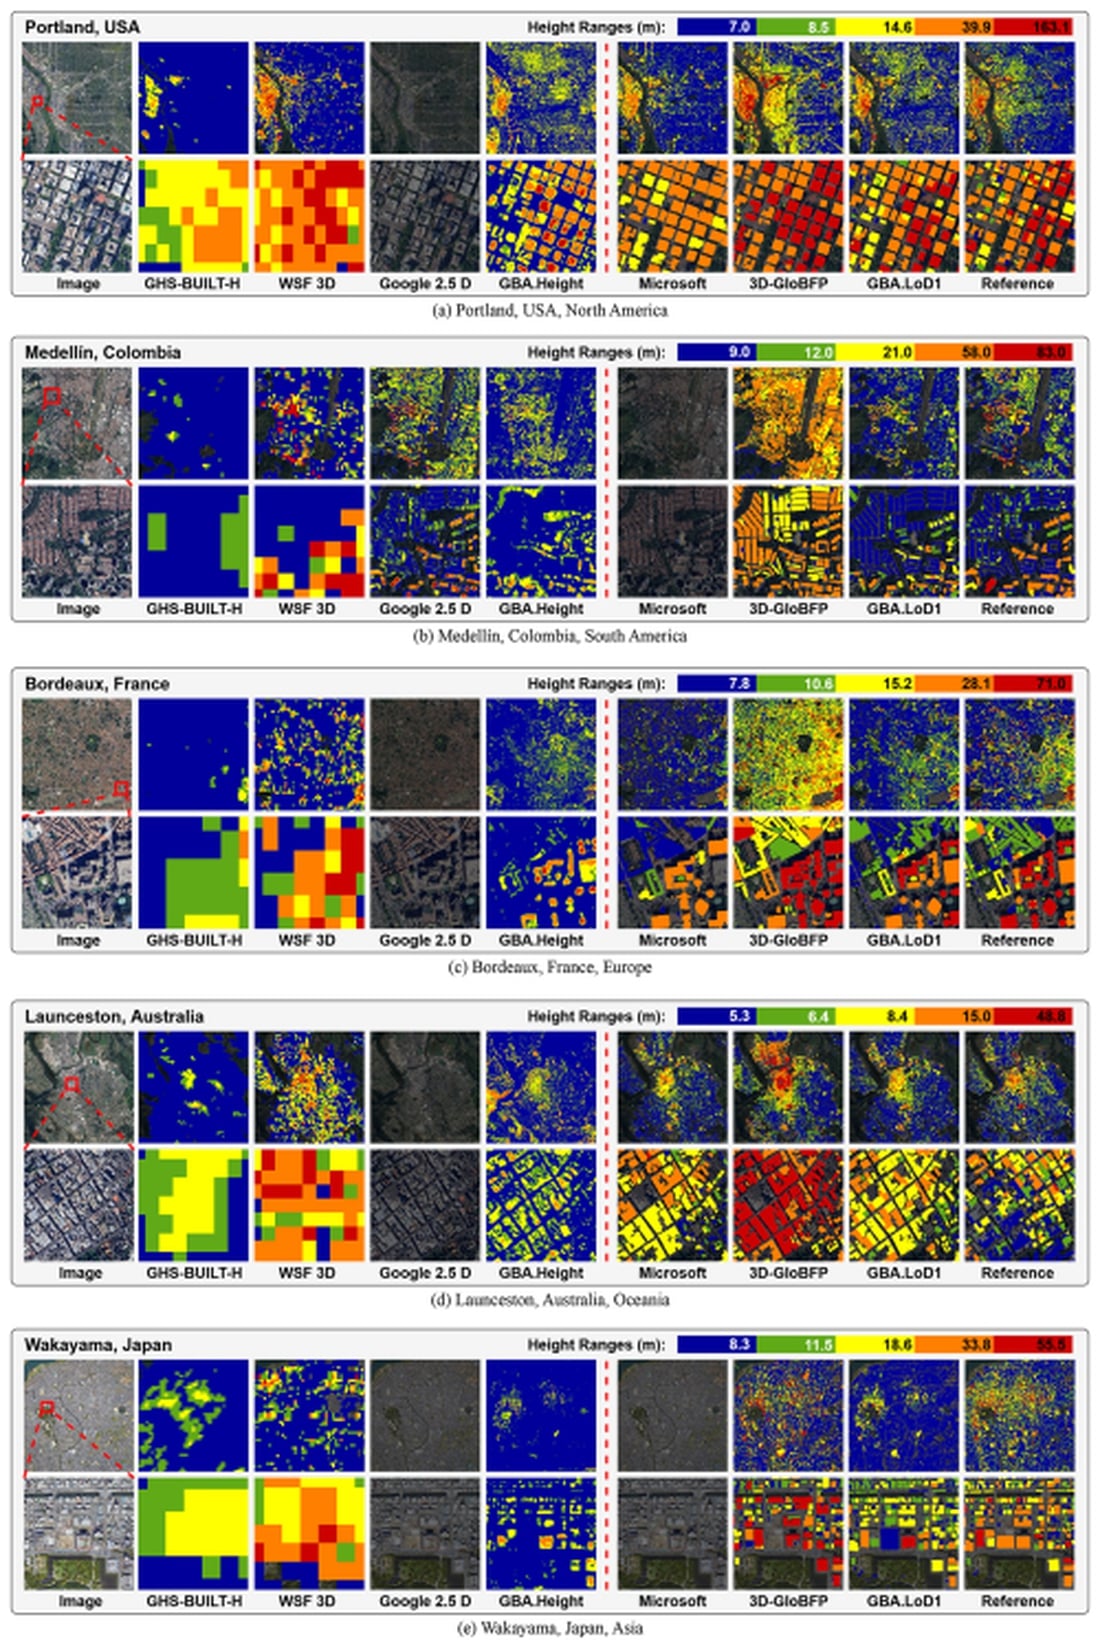
Visual comparison of existing building height products in test cities Portland (North America), Medellín (South America), Bordeaux (Europe), Launceston (Oceania), and Wakayama (Asia) - Source: Earth System Science Data/Article
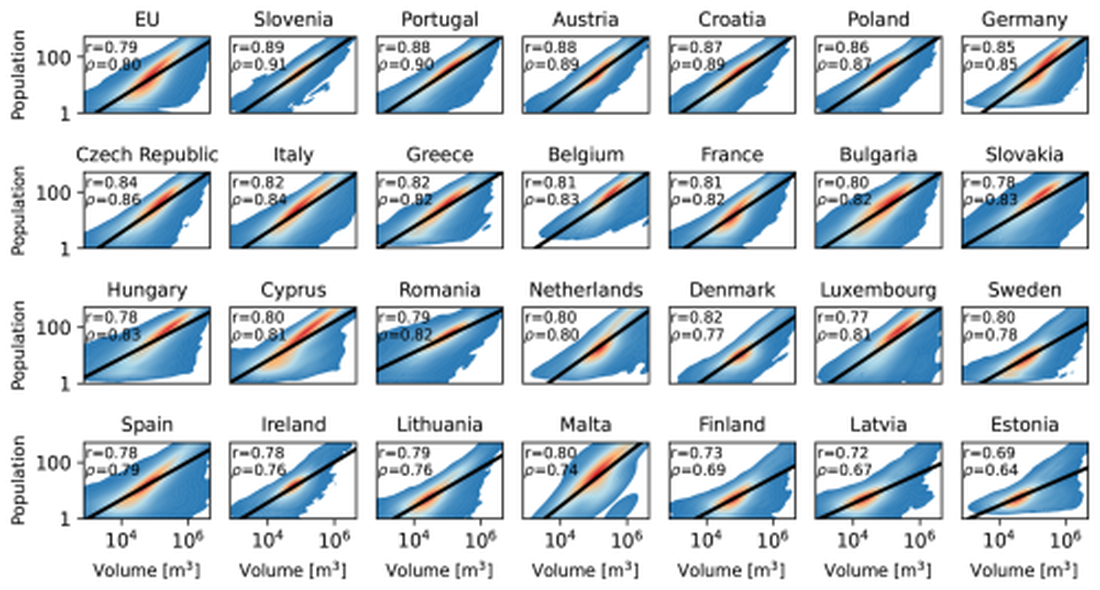
Population and construction volume analyses were conducted for the entire EU as well as for each of the 27 individual EU member states - Source: Earth System Science Data/Article
Source: https://tuoitre.vn/cong-bo-ban-do-3d-khong-lo-mo-phong-2-75-ti-toa-nha-tren-toan-the-gioi-20251213084909014.htm


![[INFOGRAPHIC] Huawei FreeBuds 7i, Noise-Canceling Headphones 4.0](https://vphoto.vietnam.vn/thumb/402x226/vietnam/resource/IMAGE/2025/12/13/1765633184506_info-tainghechongon-02-jpg.webp)


Comment (0)