
Difference in scores between admission combinations
Based on the general guidance of the Ministry of Education and Training and the 2025 high school graduation exam score distribution, Hanoi University of Science and Technology announces the score difference between admission groups using high school graduation exam scores as follows:
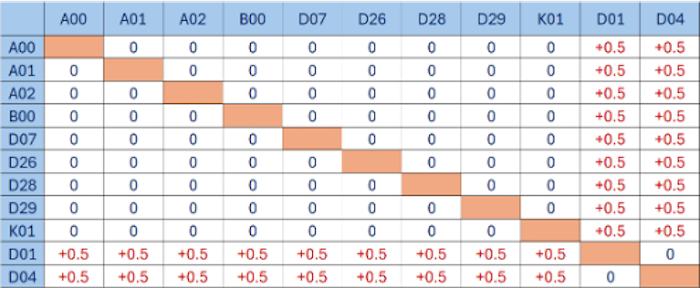
Accordingly, for the combinations used for admission to the technical group including A00, A01, A02, B00, D07, D26, D28, D29 and K01, there will be no score deviation.
The combinations used for admission to the economic , education, and foreign language groups including D01 and D04 also have no score deviation.
The difference in scores between the combinations used for admission to the technical group (A00, A01, A02, B00, D07, D26, D28, D29 and K01) and the combinations used for admission to the economic, education and foreign language groups (D01 and D04) is +0.5 points to the standard score when considering the same training program for the combinations A00, A01, A02, B00, D07, D26, D28, D29 and K01.
For example, the FL3-Chinese for Science and Technology program is recruiting with 3 high school graduation score combinations: K01, D01 and D04. If the admission score according to the D01 combination is 20 points , the admission score according to the D04 combination is still 20 points , and the admission score according to the K01 combination is 20.5 points .
Converting benchmark scores between admission methods
Based on the general guidelines of the Ministry of Education and Training, Hanoi University of Science and Technology applies the percentile method to find equivalent standard scores between the three admission methods this year including: Talented admission, Admission based on thinking assessment test scores and Admission based on high school graduation exam scores.
In addition, Hanoi University of Science and Technology also conducted statistics and analyzed enrollment data of the past 3 years, different admission combinations, analyzed the distribution of talent admission scores by area, TSA exam score distribution, and 2025 high school graduation exam score distribution with 2 original combinations A00 and D01 to serve as a basis for determining the correlation percentile range.
The correlation percentile table between admission methods of Hanoi University of Science and Technology is determined through the Percentile method on the data set of candidates with both TSA test scores and high school exam scores according to combination A00; Data set of candidates with both TSA test scores and high school exam scores according to combination D01; Top % of talent admission scores for categories 1.2 and 1.3 is calculated on the total number of candidates with scores according to the talent admission method from the floor score to the highest level; Top % of TSA scores is calculated on the total number of candidates with TSA scores from the floor score to the highest level.
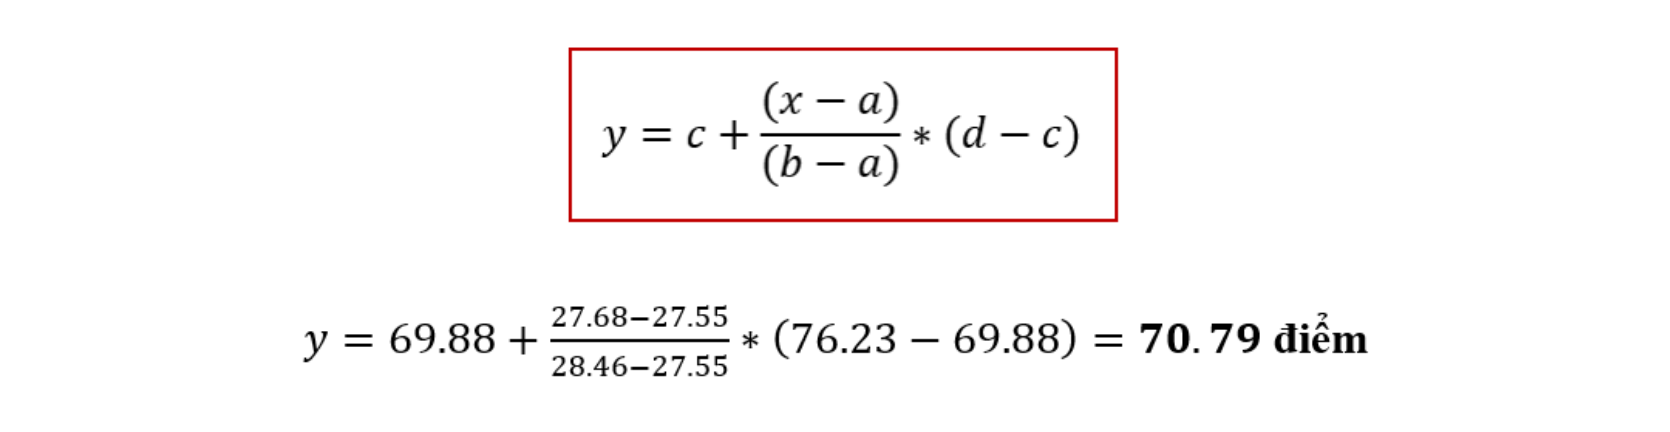
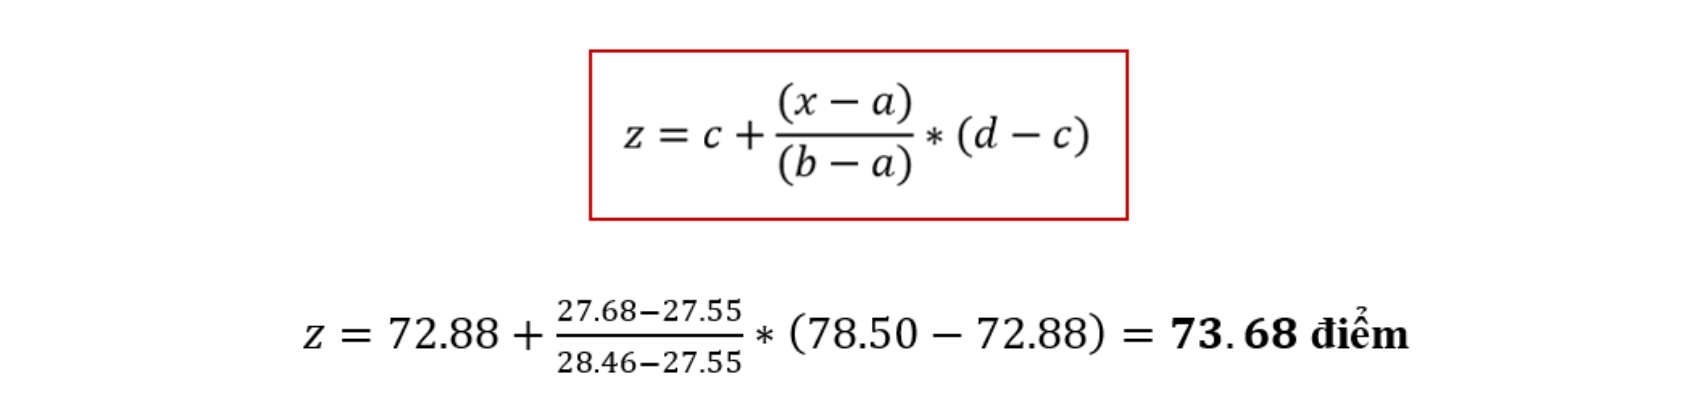
From the Correlation Percentile Table with specific percentile score range values, the conversion function between different admission methods will be interpolated. Accordingly, from the standard score 𝑥 belonging to the percentile range [𝑎, 𝑏) of this admission method, it will be interpolated to the standard score 𝑦 belonging to the percentile range [𝑐, 𝑑) corresponding to another admission method according to the following formula:

Equivalent benchmark conversion table for 2025 data
From the published score data of the methods, the correlation table of standard score levels between the 2025 admission methods of Hanoi University of Science and Technology is specifically determined according to the two original combinations A00 and D01 as follows:
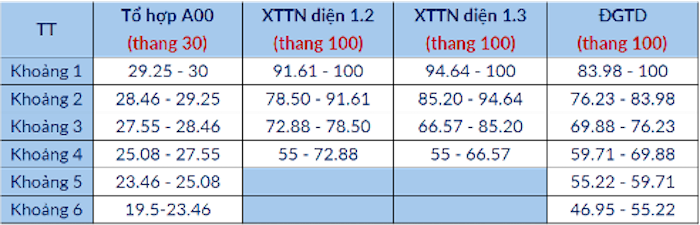
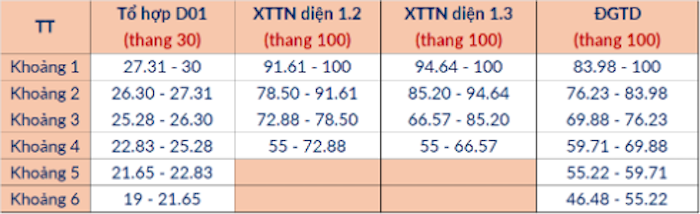
Illustration of how to calculate equivalent standard score conversion:
For example, the benchmark (admission score) of the MS2-Microelectronic Engineering and Nanotechnology program of Hanoi University of Science and Technology using the high school graduation exam score according to the A00 combination is 27.68 points (x = 27.68). Thus, this benchmark score will be in the 3rd percentile (Around 3) in Table 1, with a high school score value from (27.55-28.46). Then the equivalent benchmark score for the DGTD exam score will be in the corresponding percentile (Around 3) in Table 1 with a DGTD score value from (69.88-76.23). From there, the corresponding conversion coefficients will be determined as:
a = 27.55; b = 28.46; c = 69.88; d = 76.23
Applying the interpolation formula to calculate the equivalent standard score for the TSA exam score y from the high school standard score according to the combination A00 x = 27.68 will be calculated as follows:
Similarly, the equivalent benchmark score for the 1.2 talent selection score for the MS2 program will be in the corresponding percentile range (Ranger 3) in Table 1 with the 1.2 talent selection score value from (72.88-78.50). Then the corresponding conversion coefficients will be:
a = 27.55; b = 28.46; c = 72.88; d = 78.50
Applying the interpolation formula to calculate the equivalent standard score for the 1.2 z talent admission score from the high school standard score according to the combination A00 x = 27.68 will be calculated as follows:
Similarly, for example, the benchmark score of the EM1-Energy Management program/industry using the high school graduation exam score according to the D01 combination is 22.56 points (x = 22.56). Thus, this benchmark score will be in the 5th percentile (Around 5) in Table 2, with a high school score value from [21.65 - 22.83]. Then the equivalent benchmark score for the TSA exam score will be in the corresponding percentile (Around 5) in Table 2 with a TSA score value from [55.22 - 59.71]. From there, the corresponding conversion factors will be determined as:
a = 21.65; b = 22.83; c = 55.22; d = 59.71
Applying the interpolation formula to calculate the equivalent standard score for the talent entrance exam score y from the high school standard score according to the combination D01 x = 22.56 will be calculated as follows:

For the talent admission scores of categories 1.2 and 1.3, there is no corresponding percentile range in Table 2, so the equivalent benchmark score for the talent admission scores of categories 1.2 and 1.3 will be the floor score of 55 points.

Source: https://vietnamnet.vn/dai-hoc-bach-khoa-ha-noi-cong-bo-bang-quy-doi-diem-chuan-chinh-thuc-nam-2025-2423015.html

![[Photo] National Assembly Chairman Tran Thanh Man received a delegation of the Social Democratic Party of Germany](https://vphoto.vietnam.vn/thumb/1200x675/vietnam/resource/IMAGE/2025/10/28/1761652150406_ndo_br_cover-3345-jpg.webp)


![[Photo] Draft documents of the 14th Party Congress reach people at the Commune Cultural Post Offices](https://vphoto.vietnam.vn/thumb/1200x675/vietnam/resource/IMAGE/2025/10/28/1761642182616_du-thao-tai-tinh-hung-yen-4070-5235-jpg.webp)


![[Photo] President Luong Cuong attends the 80th Anniversary of the Traditional Day of the Armed Forces of Military Region 3](https://vphoto.vietnam.vn/thumb/1200x675/vietnam/resource/IMAGE/2025/10/28/1761635584312_ndo_br_1-jpg.webp)


Comment (0)